At a glance
The parts of a plot, and what each one does.
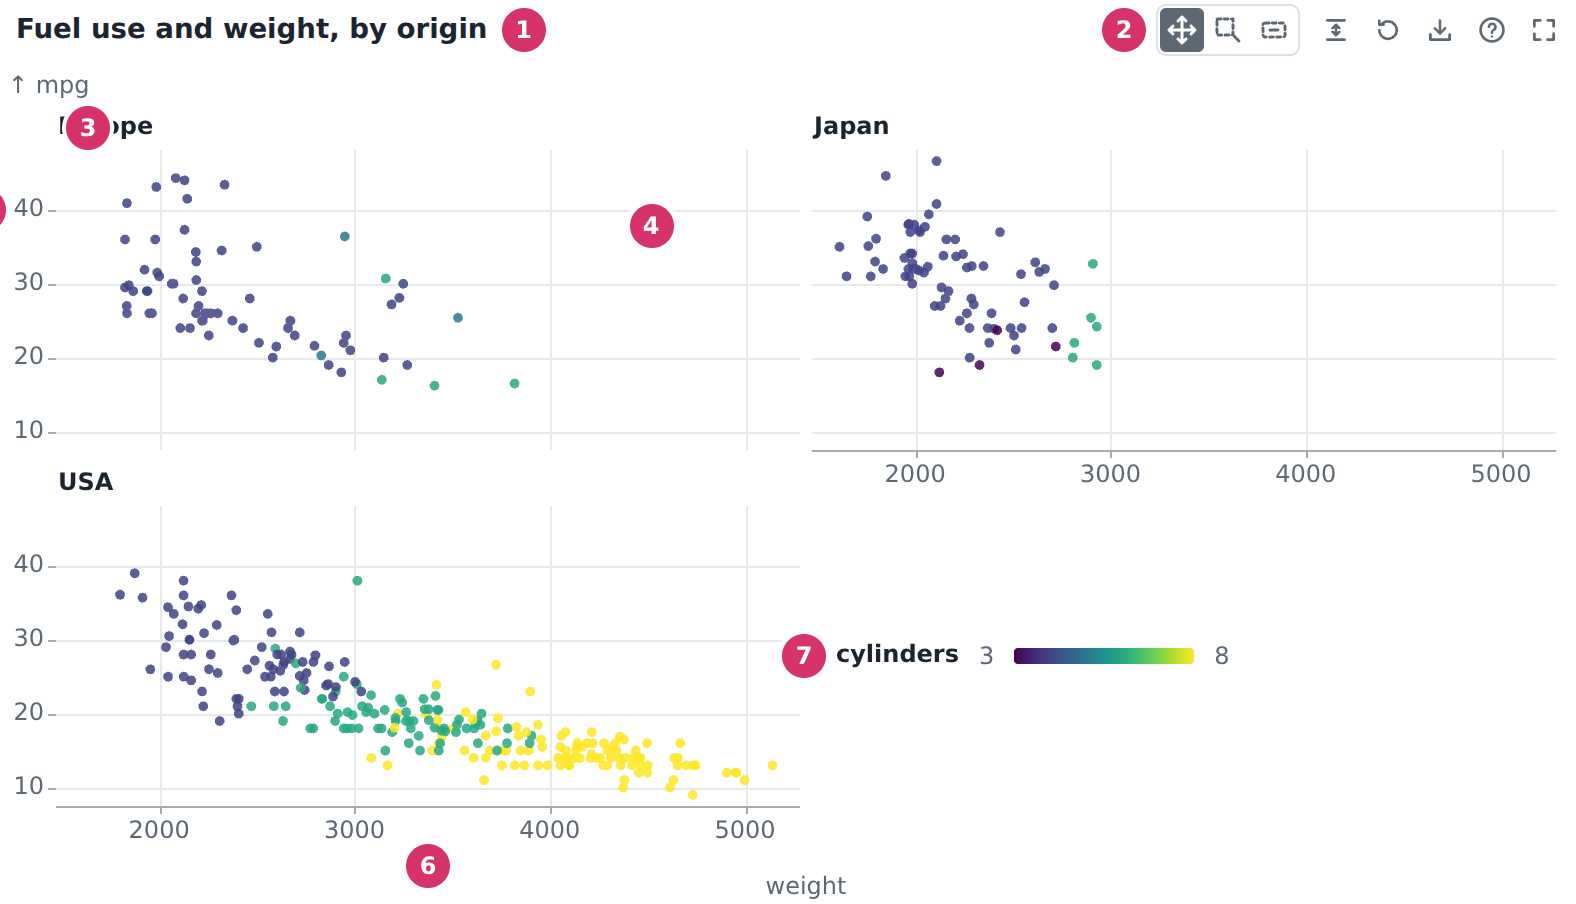
Trellis(cars, wrap="origin", cols=2, panel_height=150,
        title="Fuel use and weight, by origin").points(
    x="weight", y="mpg", color="cylinders", size=5)
- Title:
title=. - Toolbar: what a drag does (pan, box zoom or select), then fit y, reset, export, help and full screen. Each has a key; see Mouse and keys. Export copies or saves an image of the plot: see Share a plot. Help (?) lists the keys and says which renderer draws the plot, WebGPU, WebGL2 or Canvas 2D (How the plot is drawn). Once the plot is zoomed, selected or filtered, a chip beside the toolbar says so, with its way back.
- Strip: the value of the facet column for the panel under it (
wrap=, orrow=andcol=for a grid). With a panel opened, it holds All panels and the previous and next buttons. See Choose a facet layout. - Panel: the rows with that value. Scroll to zoom, drag to pan, double-click to see it alone. See Mouse and keys.
- Y axis: shared by every panel, so the heights compare across them; only the outer panels label it. Scroll or drag on it to zoom or pan y alone. See Share or free the scales.
- X axis: the same, for x.
- Legend: a colour per category, or a colour scale for numbers as here. Click an entry to select its marks. See Colours, legends and order.